Business Intelligence Dashboards for Small Businesses: What to Track and What It Costs

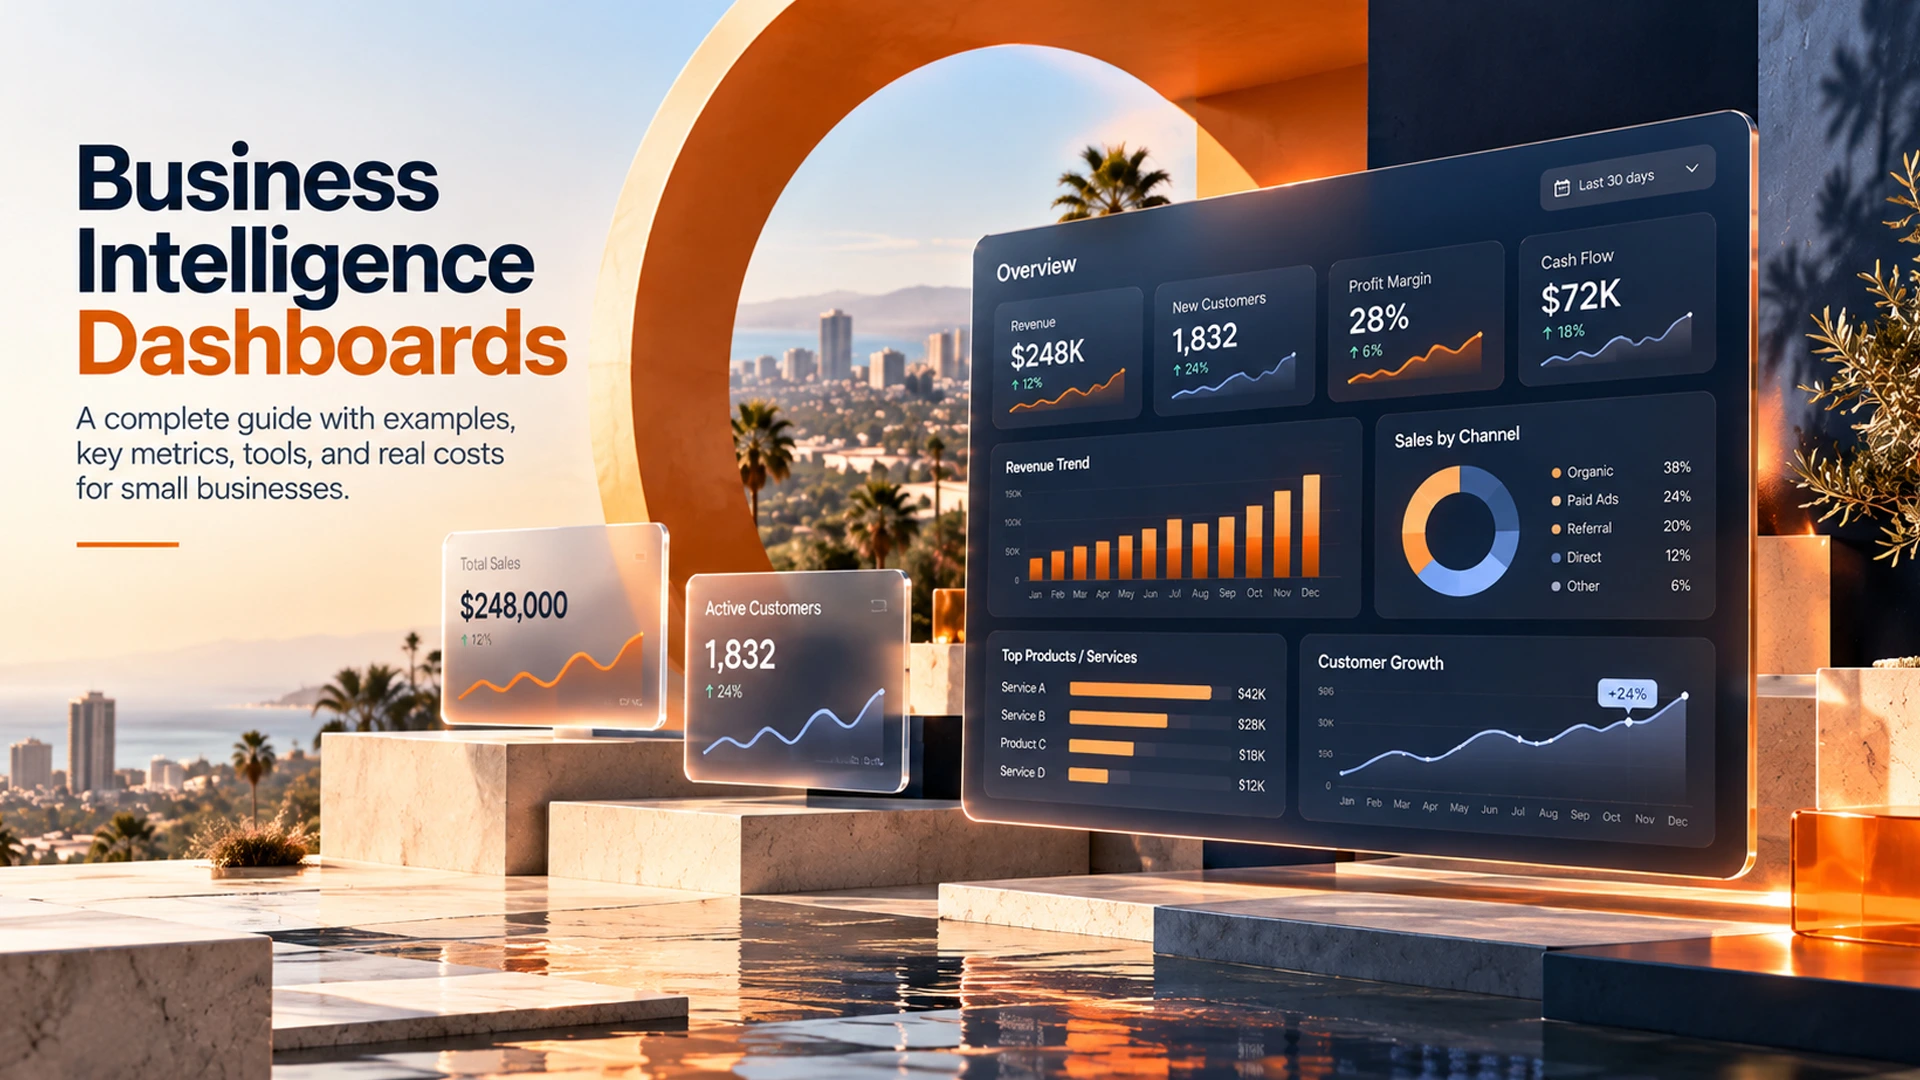
business intelligence dashboard small business owner reviewing KPIs on screen
10 min read
This guide explains what a business intelligence dashboard is, which KPIs small businesses should actually track, and how off-the-shelf tools compare to custom builds. It provides real cost ranges for both SaaS BI platforms and custom dashboard development, helping Orange County business owners budget and choose the right solution for their growth plans.
A business intelligence dashboard costs far less than most people think. It also pays for itself fast. Done right, it turns scattered spreadsheets into one screen of actionable insights you check every morning. This guide breaks down the key performance indicators (KPIs) worth tracking, the tools worth paying for, and real numbers for cost.
What Is a Business Intelligence Dashboard?
A business intelligence dashboard pulls data from your sales, marketing, and operations tools into one visual screen. Instead of opening five spreadsheets, you see performance metrics update in real time. Because of this, you spot problems before they get expensive.
Think of it like a car dashboard for your company. You don’t need to understand the engine to know when fuel is low. In the same way, business dashboards turn raw numbers into clear data visualizations that anyone on your team can read at a glance. This supports faster, data-driven decisions across the whole business.
Many business intelligence dashboard examples follow this same idea. They take messy data points and turn them into simple charts. The goal is always the same: clear business insights, not more spreadsheets.
Key Performance Indicators Every Small Business Should Track
Most small businesses only need five to eight core KPIs on their main dashboard. Tracking fifty metrics creates noise, not clarity. The right performance metrics depend on your industry, but a few apply almost everywhere.
Financial Health Metrics
Cash flow, gross margin, and monthly recurring revenue show whether your business is healthy. For example, a retail shop might track daily sales against the same day last year. A service business, however, should watch outstanding invoices and average payment time.
- Revenue trend (weekly and monthly)
- Gross profit margin
- Cash flow and runway
- Accounts receivable aging
Customer and Growth Metrics
Customer acquisition cost and lifetime value show whether your marketing spend actually works. Meanwhile, lead-to-customer conversion rate shows where prospects drop off. Tracked together, these data points support real trend analysis instead of guesswork.
- Customer acquisition cost (CAC)
- Customer lifetime value (CLV)
- Lead-to-customer conversion rate
- Customer churn or retention rate
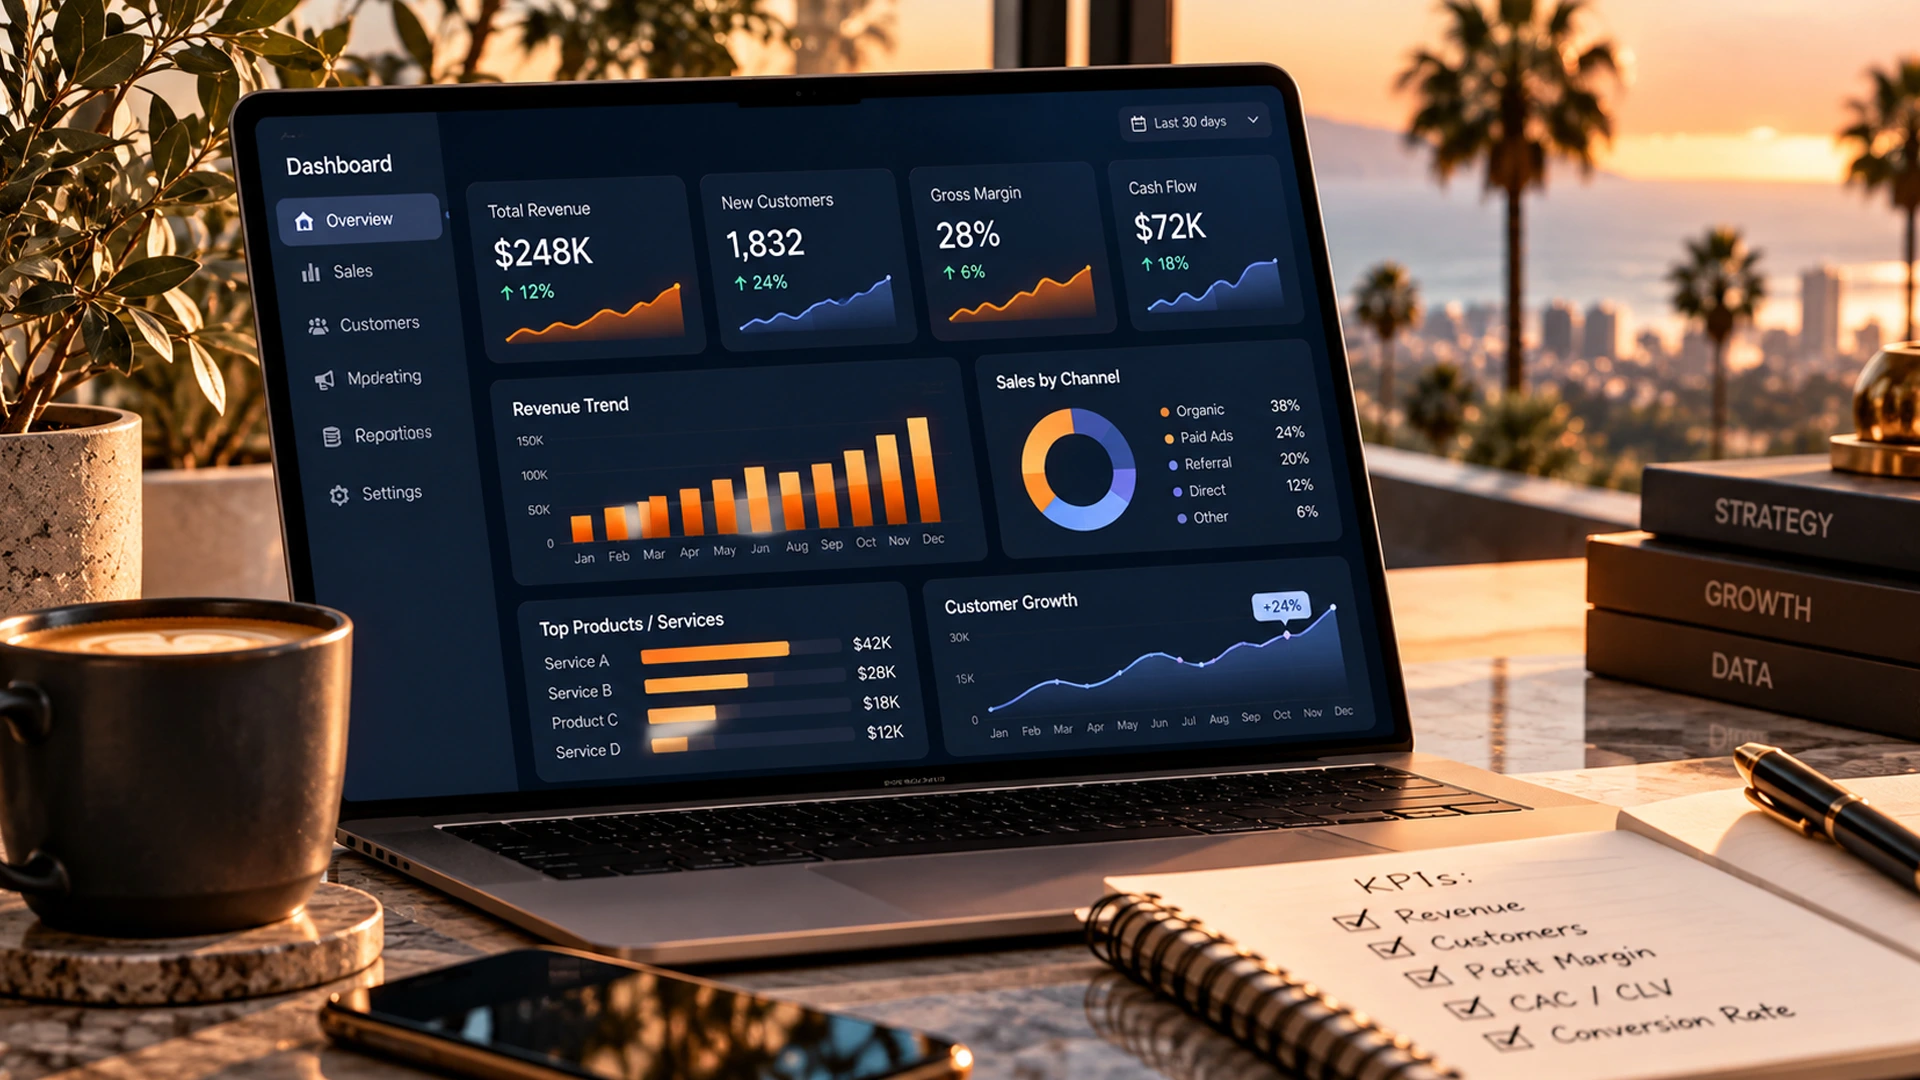
key performance indicators displayed on a business dashboard screen
Off-the-Shelf Tools vs Custom Dashboards
Small businesses generally pick between two paths. One option is a ready-made bi tool like Power BI or Tableau. The other is a custom dashboard built around your exact workflow. Both can deliver real-time dashboards and self-service analytics, but they fit different situations.
Off-the-shelf tools work well when your data sources are standard, such as QuickBooks or Shopify. They offer solid reporting and analytics out of the box. You also get quick setup and predictable monthly pricing. As a result, many businesses start here before they outgrow the templates.
Custom dashboards make more sense once your workflows get specific. For example, you may need to combine a legacy CRM with field service software and a scheduling tool. A custom build also gives you full control over ease of use, dashboard design, branding, and which performance metrics show up first.
Factor
Off-the-Shelf Tool
Custom Dashboard
Setup time
Days to a few weeks
4 to 12 weeks
Typical cost
$10 to $70 per user/month
$5,000 to $50,000+ one-time
Flexibility
Limited to template features
Built around your exact data sources
Scalability
Good, but add-on costs grow
Built to grow with you
Best for
Standard tools (QuickBooks, Shopify)
Multiple or legacy systems
This pricing and features comparison is a good starting point. But your final choice should also weigh scalability and who will manage the tool day to day.
Where Your Data Comes From (and Why Integration Matters)
A dashboard is only as good as the data feeding it. Because of this, data integration is often the hardest part of any BI project, not the charts themselves. Most small businesses pull from three to five data sources.
- CRM (HubSpot, Salesforce, or a legacy system)
- Point-of-sale or e-commerce platform
- Accounting software (QuickBooks, Xero)
- Marketing platforms (Google Ads, email tools)
- Spreadsheets for anything not yet automated
The Integration Problem Nobody Mentions
Many small business owners buy a BI tool, connect one data source, and stop there. As a result, the dashboard only shows half the picture. Good integrations sync data automatically overnight, so your numbers stay accurate without manual exports.
This is also where many off-the-shelf tools fall short without extra connector work. If a bi tool can’t reach all your systems, your reporting and analytics will always have gaps. That’s why checking integrations early saves time and money later.
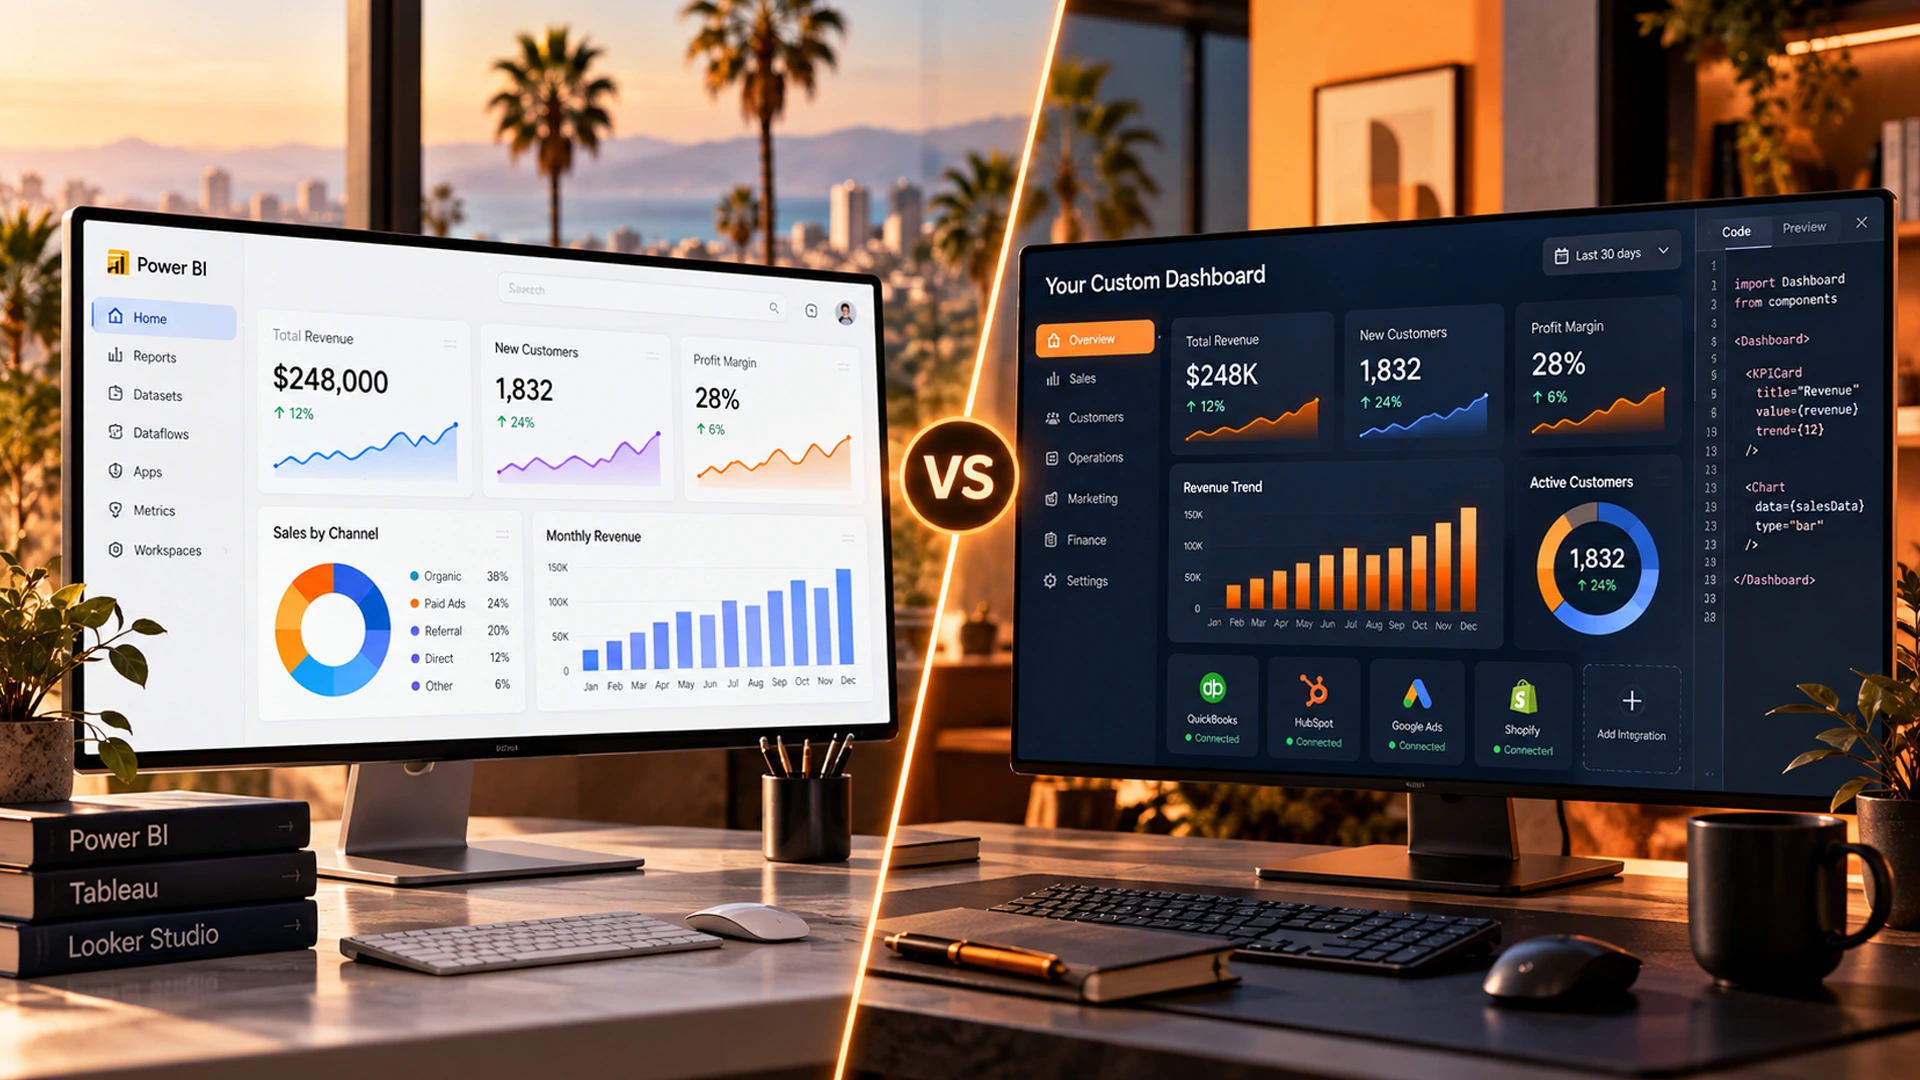
custom dashboards compared to off-the-shelf business intelligence tools
Business Intelligence Dashboard Cost: What You Should Actually Budget
Cost varies widely, and vague “it depends” answers don’t help with budgeting. So, here is a realistic breakdown based on common project types.
A self-service analytics subscription for a small team typically runs $300 to $1,500 per month. The exact price depends on user count and data volume. A fully custom dashboard, on the other hand, usually costs between $5,000 and $50,000 upfront, plus modest hosting fees afterward.
Option
Typical Cost
What You Get
Basic SaaS tool (Power BI, Looker Studio)
$10-$70/user/month
Pre-built templates, limited customization
Mid-tier BI platform
$500-$2,000/month
More integrations, better support
Custom dashboard (small scope)
$5,000-$15,000 one-time
2-3 data sources, core KPIs, custom design
Custom dashboard (full build)
$20,000-$50,000+ one-time
Multiple data sources, automation, scalability
Ongoing maintenance adds another cost line most owners forget. Budget 10 to 20 percent of the build cost each year. This covers updates, new integrations, and customer support from your development partner.
How to Choose the Right Business Intelligence Solution in Orange County
Finding the right business intelligence dashboards for your business means weighing pricing and features comparison against your actual growth plans, not just today’s needs. A dashboard that can’t scale will need a costly rebuild within two years.
First, list your must-have data sources. Next, decide if a template tool covers them or if you need custom integration work. Then, figure out who will maintain the dashboard, since ease of use matters less if nobody updates it after launch.
- Confirm the vendor supports your existing CRM and accounting software
- Ask about data refresh frequency (real time data vs daily batch)
- Check training and customer support included in the price
- Request a scalability plan for when you add new locations or products
A good bi report should answer questions fast, without extra clicks. If your business users need training just to find a number, the design needs work.
OC Imagine builds custom software and AI-powered analytics for small and mid-sized businesses across Orange County. We connect CRMs, ERPs, and cloud platforms into one clear reporting and analytics view. Explore our custom software development services to see how a tailored dashboard could fit your operations.
According to the Gartner IT glossary, business intelligence combines data analytics with tools that drive informed decision-making across an organization. That’s exactly the standard a good small business dashboard should meet.
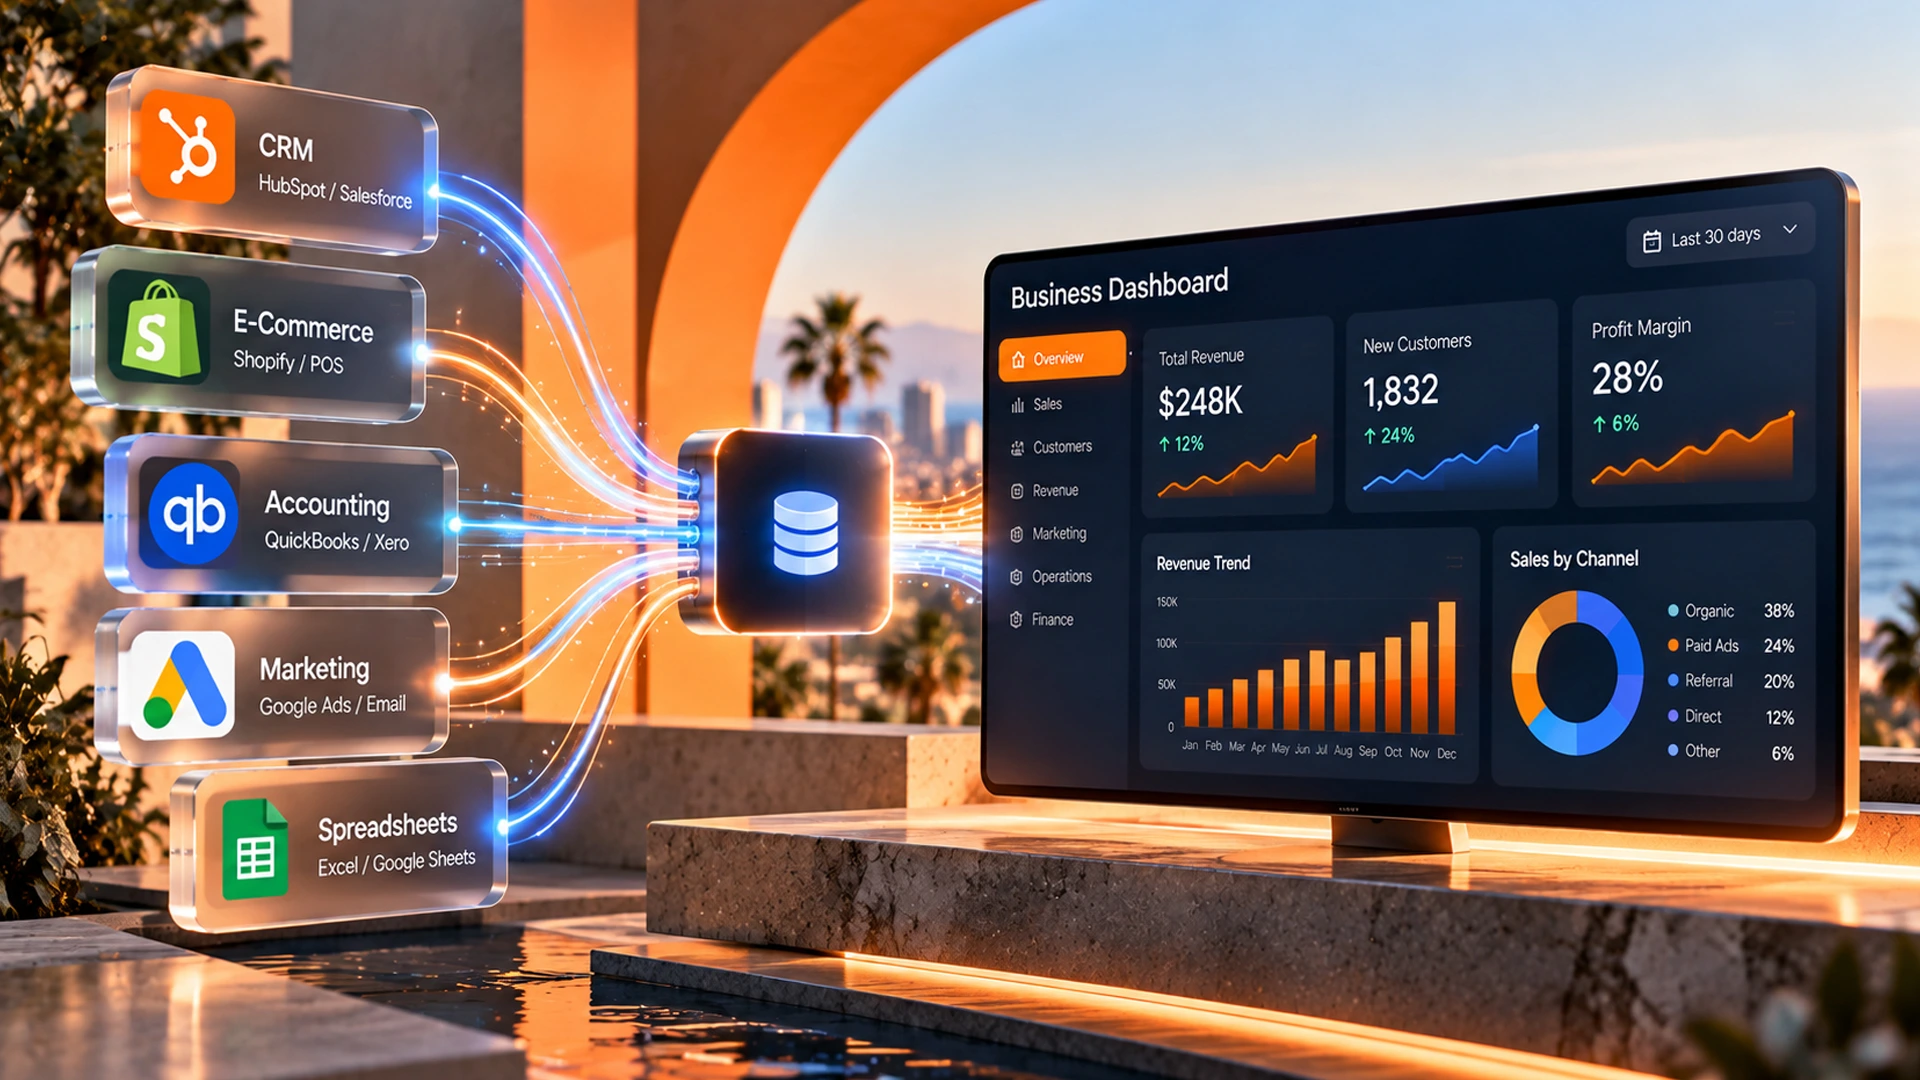
data integration connecting business sources to a BI dashboard
How to Create a BI Dashboard That Your Team Will Actually Use
Building a business intelligence tool is only half the job. The other half is getting your team to open it every day. A great bi dashboard should feel simple, not like extra homework.
First, pick one owner for the dashboard. This person checks that data sources stay connected and that KPIs still make sense as the business changes. Without an owner, dashboards slowly go stale.
Second, keep the layout simple. Put your top five metrics at the very top of the screen. Save detailed breakdowns for a second tab or page. This keeps business users focused on what matters most.
Third, test the dashboard with real business decisions in mind. For example, could a manager use it to decide whether to run a sales promotion this week? If not, the dashboard needs better performance metrics, not more charts.
Finally, review the dashboard every quarter. Business needs change, and your KPIs should change with them. A bi report that made sense last year may not fit your current goals.
Common Mistakes Small Businesses Make With BI Dashboards
Many business intelligence dashboards fail for the same few reasons. Knowing these mistakes ahead of time can save you both money and time.
First, some owners track too many metrics at once. This buries the important numbers under less useful ones. Stick to your core KPIs and resist the urge to add more just because you can.
Second, some businesses skip proper data integration. They connect one source and assume the picture is complete. In reality, partial data leads to partial, and sometimes wrong, business decisions.
Third, many teams forget about scalability. A dashboard that works fine with one location may break down once you add three more. Planning for growth early avoids a costly rebuild later.
Last, some businesses pick tools based on price alone. A cheap bi tool with poor customer support can cost more in lost time than a pricier, well-supported option. Always weigh pricing and features comparison together, not price by itself.
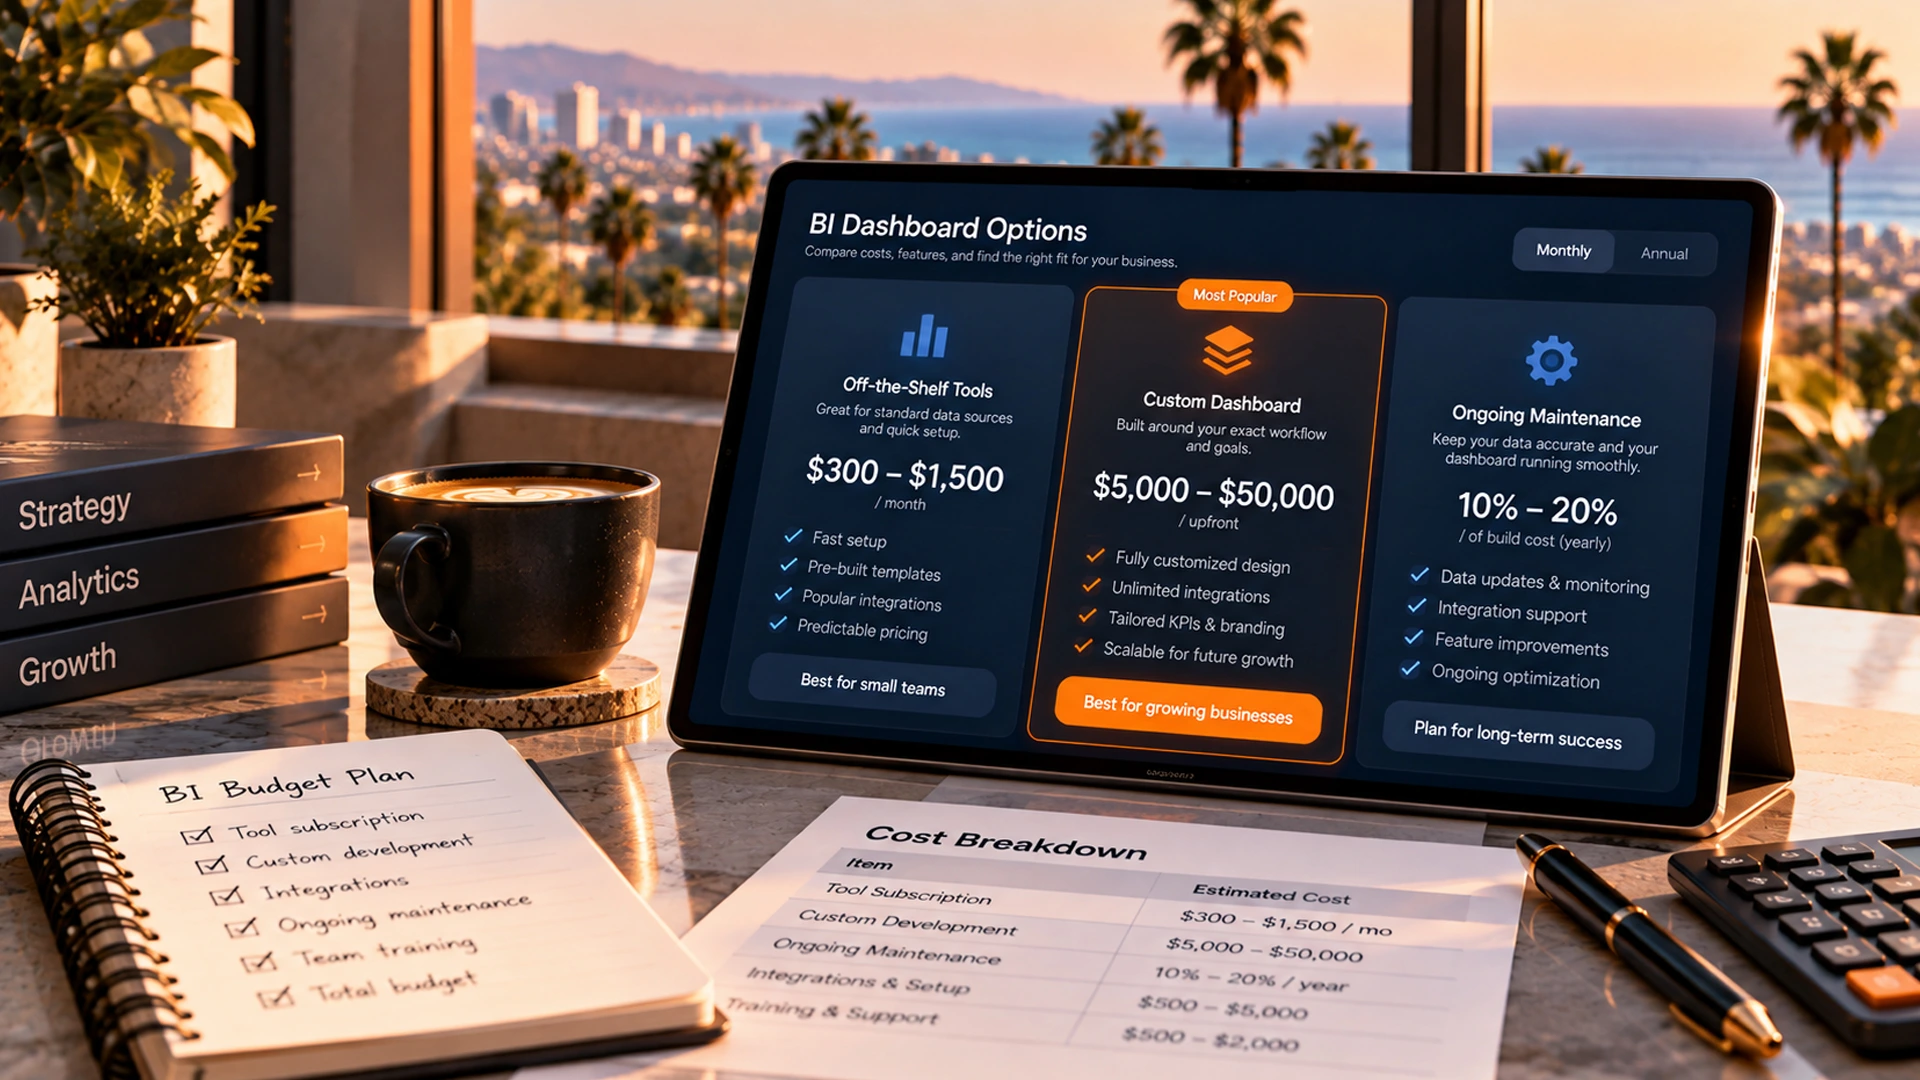
small business owner reviewing bi dashboard cost and pricing options
Ready to Build Your Business Intelligence Dashboard?
A clear, well-built business intelligence dashboard turns raw numbers into daily decisions, not quarterly guesswork. Whether you need a quick off-the-shelf setup or a fully custom build, the right data integration and the right KPIs matter more than flashy charts. OC Imagine can map your data sources, scope the right cost for your budget, and build a dashboard that grows with your business. Start with a conversation about your specific operations and data goals.
Frequently Asked Questions
What is a business intelligence system?
A business intelligence system is a combination of software and processes that pulls data from sources like your CRM, accounting platform, and marketing tools into one place, then turns it into visual reports and dashboards. Instead of manually checking separate spreadsheets, you see performance metrics update automatically, which lets you catch problems and opportunities faster. For a small business, this usually means connecting three to five core data sources into a single dashboard view.
How do I create an effective business dashboard?
Start by limiting your dashboard to five to eight core KPIs that match your industry, such as cash flow, gross margin, and customer acquisition cost, rather than tracking fifty metrics that create noise. Next, confirm your data sources (CRM, point-of-sale, accounting software) can integrate and refresh automatically, since a dashboard connected to only one source shows an incomplete picture. Finally, decide whether a template tool like Power BI covers your needs or whether your workflow requires a custom build, and plan who will maintain it after launch.
What are the best business intelligence tools for small businesses?
Popular off-the-shelf options for small businesses include Microsoft Power BI, Tableau, Looker Studio, and Qlik Sense, which offer pre-built templates, quick setup, and predictable monthly pricing starting around $10 to $70 per user. These tools work best when your data sources are standard, like QuickBooks or Shopify. Once workflows get more complex, such as combining a legacy CRM with field service software, a custom dashboard typically becomes the better fit.
Is it better to use an off-the-shelf BI tool or build a custom dashboard?
Off-the-shelf tools make sense when your data comes from standard platforms and you need something running within days to a few weeks at a lower monthly cost. Custom dashboards cost more upfront, typically $5,000 to $50,000, and take 4 to 12 weeks to build, but they give you full control over data sources, branding, and scalability. The right choice depends on how many systems you need to connect and how much your reporting needs will grow over the next few years.
How much should I budget for ongoing dashboard maintenance?
Beyond the initial setup or build cost, plan to budget 10 to 20 percent of the dashboard's build cost annually for updates, new integrations, and support. This covers things like adding a new data source, adjusting KPIs as the business changes, and keeping automated data syncs running correctly. Many small business owners overlook this ongoing cost when comparing SaaS subscriptions against a one-time custom build.
What KPIs should a small business track on its dashboard?
Core financial metrics worth tracking include revenue trend, gross profit margin, cash flow and runway, and accounts receivable aging. On the growth side, customer acquisition cost, customer lifetime value, lead-to-customer conversion rate, and churn or retention rate show whether marketing and sales efforts are working. Most small businesses only need five to eight of these KPIs visible at once to keep the dashboard useful rather than overwhelming.